How to grab ADC concentration, DAR, and size on Stunner
Blog
ADCs stopping your high-throughput characterization?
Antibody-drug conjugates (ADCs) can put up major roadblocks when trying to accelerate to high-throughput characterization. UV/Vis spectroscopy is the simplest method for antibody concentration and drug-antibody ratio (DAR), but when the UV/Vis absorbance of an antibody and drug overlap then things are no longer so easy. On top of that, sample volume is always precious and ADCs need to be screened carefully for aggregation.
Stunner uses 2 µL of sample in its ADC applications to deliver answers on quantification and DAR from UV/Vis absorbance for 96 samples in just 10 minutes. Stunner can add dynamic light scattering (DLS) to check ADCs’ size, discover when aggregation has struck, and still be done with a full plate in an hour.
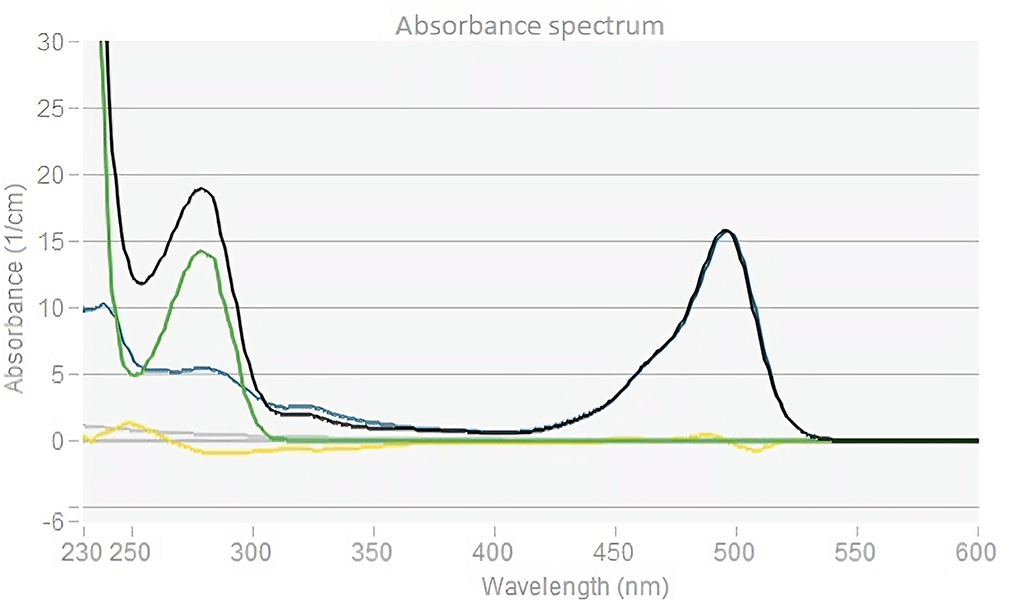
Unmix algorithms in Stunner handle overlapping antibody and drug UV/Vis absorbance spectra to keep characterization high-throughput. Teach Stunner the separate spectra of the antibody and drug and it will deconvolute the overall absorbance spectrum of your ADC (black line) into the contribution coming from the mAb (green line) and the drug or conjugate molecule (blue line). In this example we show the total and deconvoluted absorbance spectra from a mAb conjugated with AlexaFluor™ 350 NHS ester. From these deconvoluted spectra, Stunner can quantify the total amount of protein and drug payload present and use them to calculate the DAR.
Stunner is eager to learn
In order to analyze ADC spectra by UV/Vis, you have to be able to distinguish the antibody’s absorbance spectrum from the spectrum of the conjugated drug. However, drug spectra can vary significantly, so instruments need to be smart enough to keep up. Thankfully, Stunner can learn a drug’s absorbance spectrum from a dilution series of the drug via its Store Analyte feature.
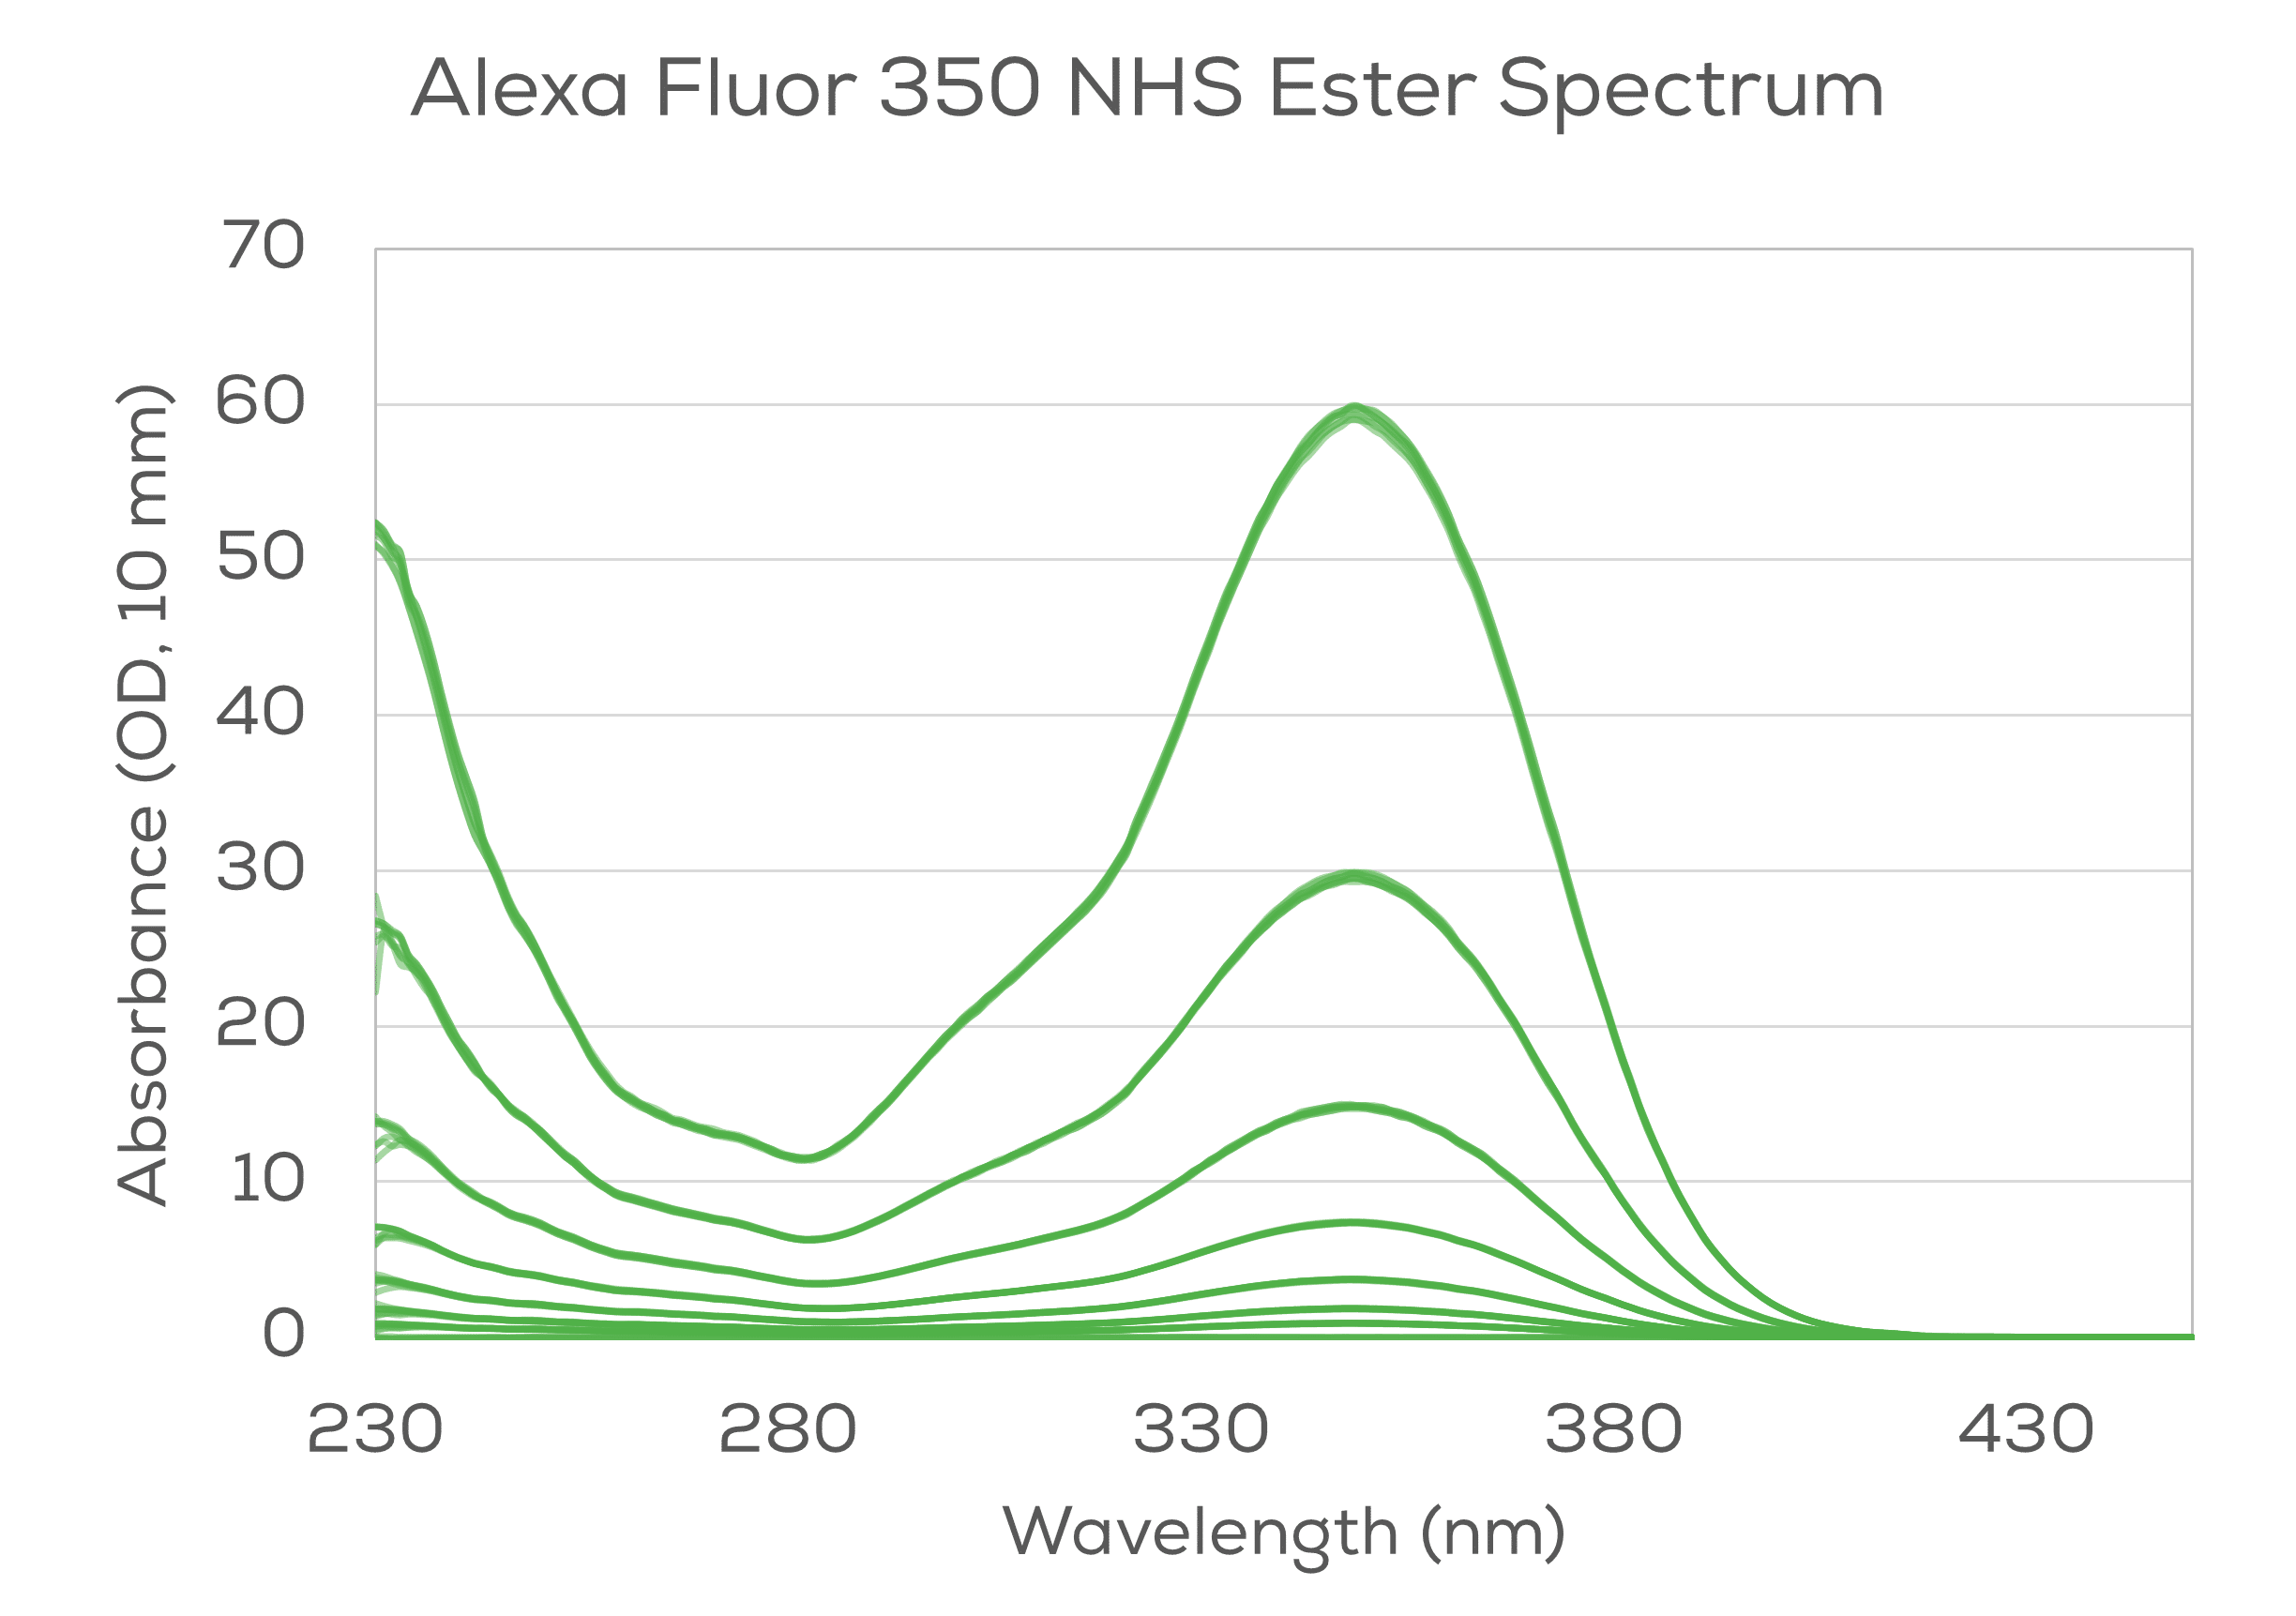
To store the spectra for the Alexa Fluor™ 350 NHS ester, solutions of 10 mg/mL in DMSO were diluted 1:9 into PBS, then the Store Analyte application’s recommendations were followed to create a 2X dilution series in 90% PBS / 10% DMSO diluent. The absorbance of the dilution series was measured on Stunner using the Store Analyte app and the spectra were saved. A spectrum of the mAb was stored the same way. These spectra were all that was needed for Stunner to quantify the ADC. No additional experiments, calculations, or reagents required.
Side-by-side DAR and sizing
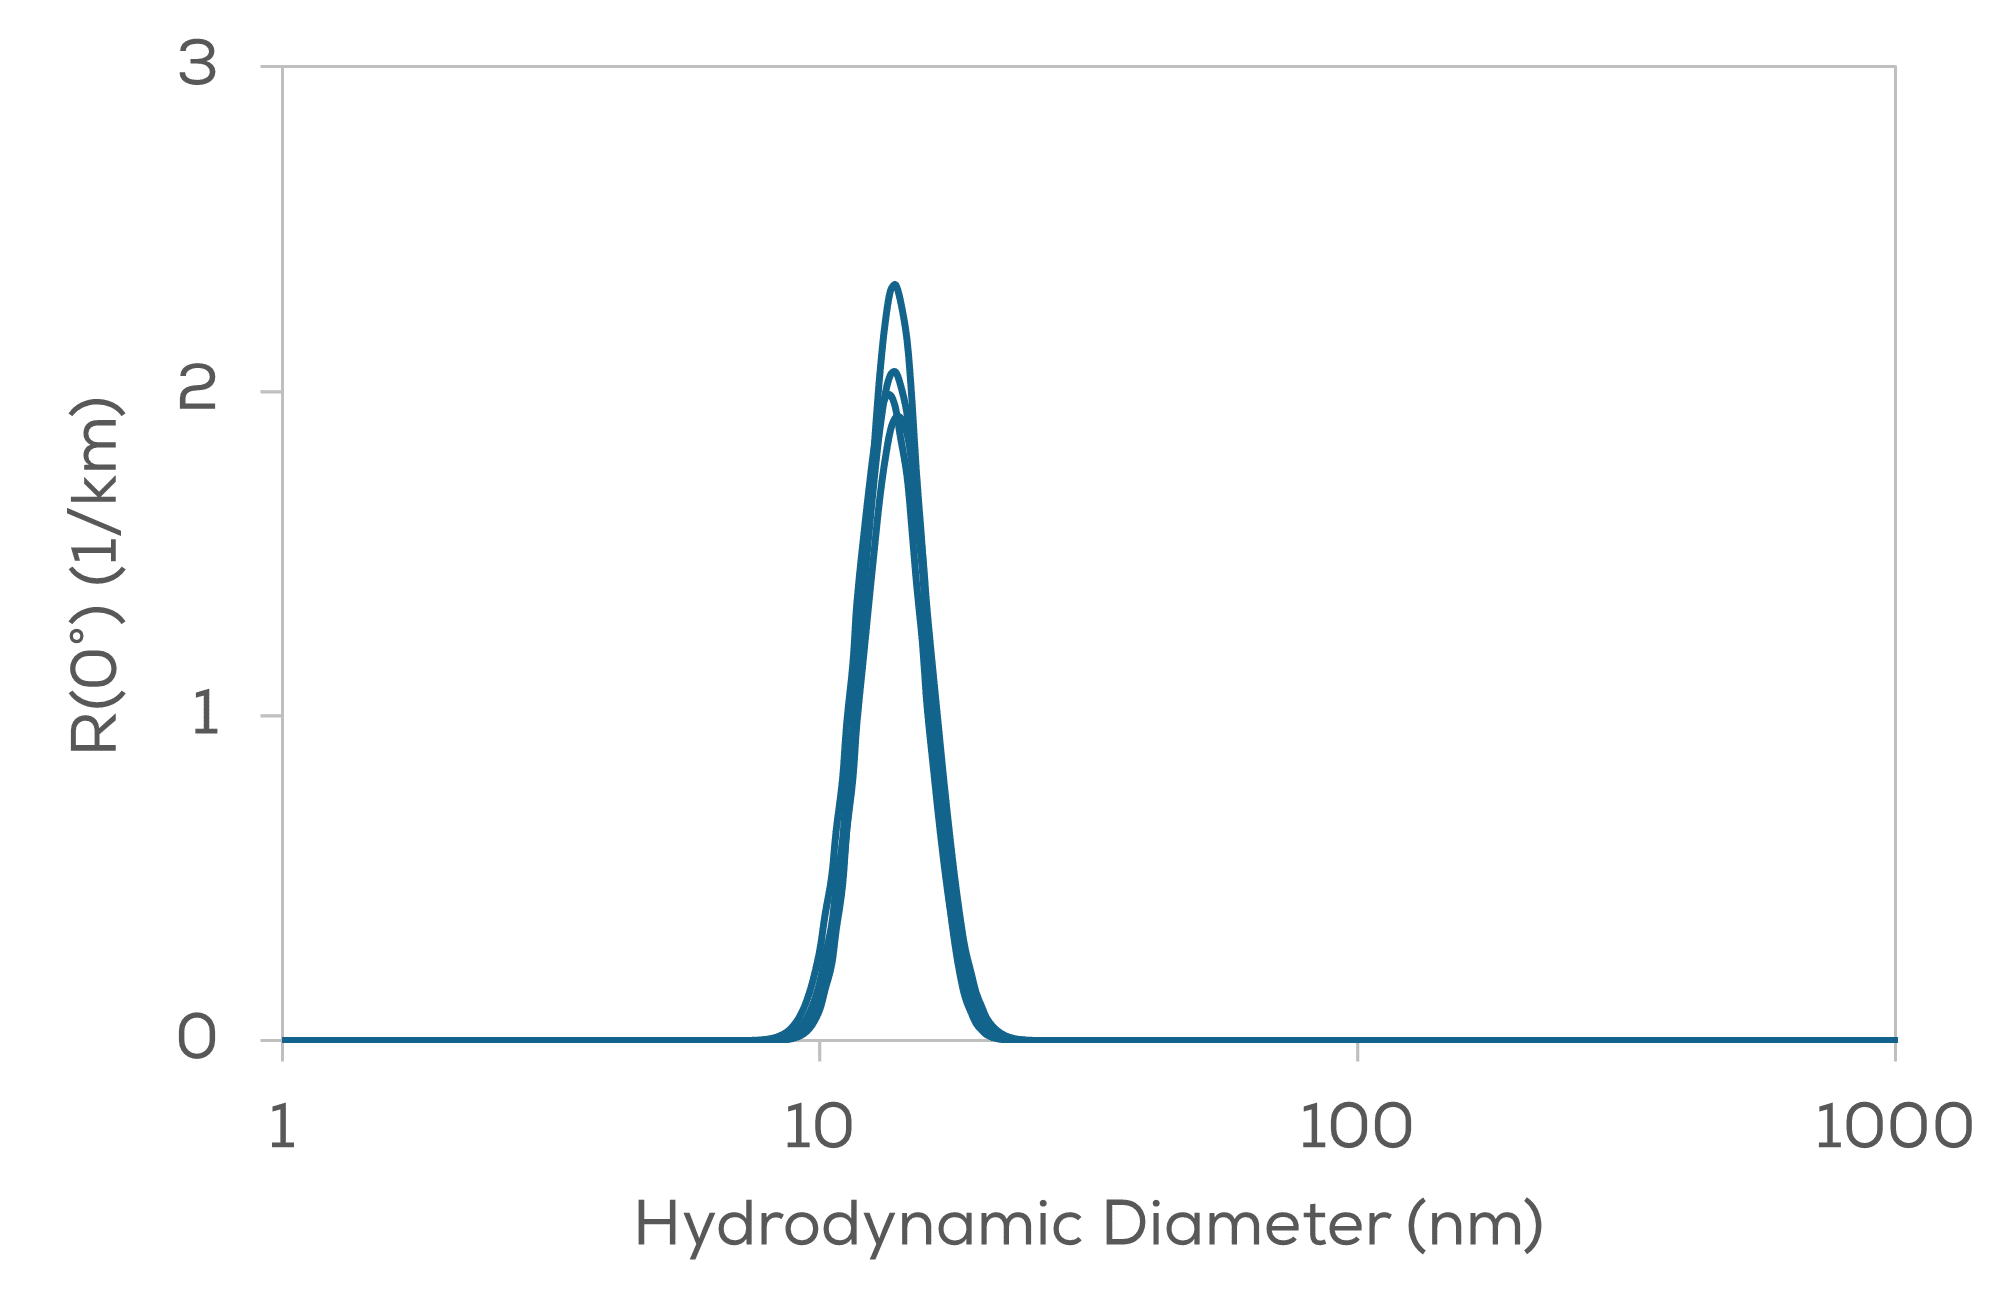
After conjugation, the ADC was purified and buffer exchanged into PBS by Unagi. The ADC + Sizing app on Stunner used the saved dye and mAb spectra to determine concentration, DAR, size, and polydispersity index (PDI) with a single read. One ADC, measured in quadruplicate, had a DAR of 9.6 with a mean Z-average size of 13.2. The sample was monodisperse with no evidence of aggregation.
Conclusion
ADC characterization is a challenge that can be as complex as the structure of ADCs themselves. Thankfully, Stunner is able to simply and rapidly quantify antibody concentration, DAR, size, and size distribution in a rapid, low-volume, high-throughput format. Stunner is fully geared up with new, dedicated applications that make characterizing ADCs even easier and faster.
For more details on this ADC experimental series, please check out this app note.
Unagi
在处理样品之前,缓冲液置换和样品浓缩可以说是令人头疼的两件事。因为它们需要花费大量的时间和人力成本。而Unagi作为一个自动化台式工具,它可以轻松地帮您处理这两件繁琐的事情。
